Detect and Extract Tabular Data From Images Using TableNet (With PyTorch)
In this article, I will walk you through an implementation of TableNet using PyTorch to detect and extract tabular data from an image. If you have other types of scanned documents, converting them to images is reasonably easy.
The TableNet paper can be found here and here.
Table of Contents


Introduction

Goal

Deep Learning Approach and Performance Metric

Data

Pre-Processing

Model Architecture

Model Implementation

Train, Test, Loss

Prediction Examples

Next Actions
Please note, I will supply you only with the important parts of the code. For the complete code, you can refer to my GitHub repo.
Introduction
Nowadays, we have many documents such as PDFs, docs, images, rich text files, and more, all of which can be converted to images. These documents have tables in them holding very important information that we need.
In this article, I will use TableNet to make an end-to-end deep learning architecture to detect the tables in an image (I will draw a rectangle around every table detected and each will also be saved in a new image for later extraction).
After the detection process is complete and the tables are saved, I will use pytesseract to extract the tabular data into a dataframe.
Goal
- Train a model capable of detecting tables in an image.
- Extract tabular data to a
dataframe.
Deep Learning Approach and Performance Metric
The approach is with semantic segmentation, predicting every pixel-wise region of the table and the columns in it.
The metric I will use here is the F1 score; it takes precision and recall in a way that reduces the likelihood of false positives and false negatives.
Data
The data I will use to train and test my model will be the Marmot and Marmot extended datasets for table recognition (the data is open-sourced by the authors of the TableNet paper).
The Marmot dataset contains English and Chinese images; I will use only English ones.
These datasets contain both images with tables and images without tables. Below are examples of each:
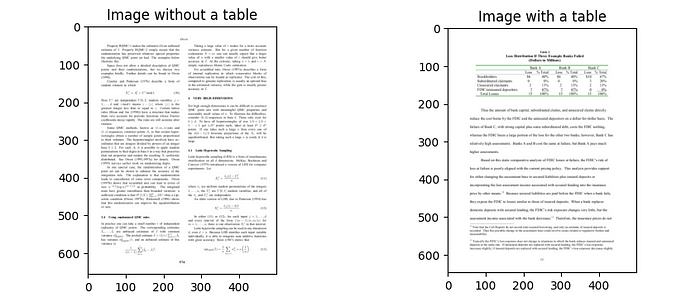
The data is in bmp images and XML files (for table coordinates), and the XML files follow the Pascal VOC format.
Pre-Processing
The tasks I will complete here are the following:
- Read an image, table XMLand column XML.
- Resize images to (1024, 1024) and convert them to RGB format
- Get both table and column bounding boxes
- Create a mask for each table and column
- Save the image and mask to the database (or where you choose to keep your data)
- For each image, add a row to a dataframe. Each row will hold the original image path, table mask path, column mask path, and other data states (such as original image height or width, number of columns, etc.)
I will define the following three functions:
get_table_bounding_box. Extract table coordinates and scale themget_column_bounding_box. Extract column coordinates and scale themcreate_element_mask. Create a mask based on the width, height, and bounding boxes of the table and columns
Below are the mentioned functions:
def get_table_bounding_box(table_xml_path: str,  new_image_shape: tuple):
    """
        Goal: Extract table coordinates from xml file and scale them to the new image shape
        Input:
            :param table_xml_path: xml file path
            :param new_image_shape: tuple (new_h, new_w)
        Return: table_bounding_boxes: List of all the bounding boxes of the tables
    """
    tree = ET.parse(table_xml_path)
    root = tree.getroot()
    left, top, right, bottom = list(map(lambda x: struct.unpack('!d', bytes.fromhex(x))[0], root.get("CropBox").split()))
    width = abs(right - left)
    height = abs(top - bottom)
    table_bounding_boxes = []
    for table in root.findall(".//Composite[@Label='TableBody']"):
        x0in, y0in, x1in, y1in  = list(map(lambda x: struct.unpack('!d', bytes.fromhex(x))[0], table.get("BBox").split()))
        x0 = round(new_image_shape[1] * (x0in - left) / width)
        x1 = round(new_image_shape[1] * (x1in - left) / width)
        y0 = round(new_image_shape[0] * (top - y0in) / height)
        y1 = round(new_image_shape[0] * (top - y1in) / height)
        table_bounding_boxes.append([x0, y0, x1, y1])
return table_bounding_boxesdef get_column_bounding_box(column_xml_path: str, old_image_shape: tuple, new_image_shape: tuple,
table_bounding_box: list, threshhold: int = 3):
"""
Goal:
- Extract column coordinates from the xml file and scale them to the new image shape and the old image shape
- If there are no table_bounding_box present, approximate them using column bounding box
Input:
:param table_xml_path: xml file path
:param old_image_shape: (new_h, new_w)
:param new_image_shape: (new_h, new_w)
:param table_bounding_box: List of table bbox coordinates
:param threshold: the threshold t apply, defualts to 3
Return: tuple (column_bounding_box, table_bounding_box)
"""
tree = ET.parse(column_xml_path)
root = tree.getroot()
x_mins = [round(int(coord.text) * new_image_shape[1] / old_image_shape[1]) for coord in root.findall("./object/bndbox/xmin")]
y_mins = [round(int(coord.text) * new_image_shape[0] / old_image_shape[0]) for coord in root.findall("./object/bndbox/ymin")]
x_maxs = [round(int(coord.text) * new_image_shape[1] / old_image_shape[1]) for coord in root.findall("./object/bndbox/xmax")]
y_maxs = [round(int(coord.text) * new_image_shape[0] / old_image_shape[0]) for coord in root.findall("./object/bndbox/ymax")]
column_bounding_box = []
for x_min, y_min, x_max, y_max in zip(x_mins, y_mins, x_maxs, y_maxs):
bounding_box = [x_min, y_min, x_max, y_max]
column_bounding_box.append(bounding_box)
if len(table_bounding_box) == 0:
x_min = min([x[0] for x in column_bounding_box]) - threshhold
y_min = min([x[1] for x in column_bounding_box]) - threshhold
x_max = max([x[2] for x in column_bounding_box]) + threshhold
y_max = max([x[3] for x in column_bounding_box]) + threshhold
table_bounding_box = [[x_min, y_min, x_max, y_max]]
return column_bounding_box, table_bounding_boxdef create_element_mask(new_h: int, new_w: int, bounding_boxes: list = None):
"""
Goal: Create a mask based on new_h, new_w and bounding boxes
Input:
:param new_h: height of the mask
:param new_w: width of the mask
:param bounding_boxes: bounding box coordinates
Return: mask: Image
"""
mask = np.zeros((new_h, new_w), dtype = np.int32)
if bounding_boxes is None or len(bounding_boxes) == 0:
return Image.fromarray(mask)
for box in bounding_boxes:
mask[box[1]:box[3], box[0]:box[2]] = 255
return Image.fromarray(mask)The libraries you’ll need for them are:
import struct
from PIL import Image
import numpy as np
import xml.etree.ElementTree as ET
Now, let's use the above functions and apply our pre-processing approach:
import os
import glob
from tqdm import tqdm
from PIL import Image
import pandas as pd
from Training.path_constants import ORIG_DATA_PATH, PROCESSED_DATA, IMAGE_PATH, TABLE_MASK_PATH, COL_MASK_PATH, POSITIVE_DATA_LBL, DATA_PATH
from preprocessing_utilities import get_table_bounding_box, get_column_bounding_box, create_element_mask

# Make directories to save data
os.makedirs(PROCESSED_DATA, exist_ok = True)
os.makedirs(IMAGE_PATH, exist_ok = True)
os.makedirs(TABLE_MASK_PATH, exist_ok = True)
os.makedirs(COL_MASK_PATH, exist_ok = True)

positive_data = glob.glob(f'{ORIG_DATA_PATH}/Positive/Raw' + '/*.bmp')
negative_data = glob.glob(f'{ORIG_DATA_PATH}/Negative/Raw' + '/*.bmp')

new_h, new_w = 1024, 1024

processed_data = []
for i, data in enumerate([negative_data, positive_data]):
    for j, image_path in tqdm(enumerate(data)):
        image_name = os.path.basename(image_path)
        image = Image.open(image_path)
        w, h = image.size
        # Convert image to RGB image
        image = image.resize((new_h, new_w))
        if image.mode != 'RGB':
            image = image.convert("RGB")
        table_bounding_boxes, column_bounding_boxes = [], []
        if i == 1:
            # Get xml filename
            xml_file = image_name.replace('bmp', 'xml')
            table_xml_path = os.path.join(POSITIVE_DATA_LBL, xml_file)
            column_xml_path = os.path.join(DATA_PATH, xml_file)
            # Get bounding boxes
            table_bounding_boxes = get_table_bounding_box(table_xml_path, (new_h, new_w))
            if os.path.exists(column_xml_path):
                column_bounding_boxes, table_bounding_boxes = get_column_bounding_box(column_xml_path, (h,w), (new_h, new_w), table_bounding_boxes)
            else:
                column_bounding_boxes = []
        # Create masks
        table_mask = create_element_mask(new_h, new_w, table_bounding_boxes)
        column_mask = create_element_mask(new_h, new_w, column_bounding_boxes)
        # Save images and masks
        save_image_path = os.path.join(IMAGE_PATH, image_name.replace('bmp', 'jpg'))
        save_table_mask_path = os.path.join(TABLE_MASK_PATH, image_name[:-4] + '_table_mask.png')
        save_column_mask_path = os.path.join(COL_MASK_PATH, image_name[:-4] + '_col_mask.png')
        image.save(save_image_path)
        table_mask.save(save_table_mask_path)
        column_mask.save(save_column_mask_path)
        # Add data to the dataframe
        len_table = len(table_bounding_boxes)
        len_columns = len(column_bounding_boxes)
        value = (save_image_path, save_table_mask_path, save_column_mask_path, h, w, int(len_table != 0), \
                 len_table, len_columns, table_bounding_boxes, column_bounding_boxes)
        processed_data.append(value)

columns_name = ['img_path', 'table_mask', 'col_mask', 'original_height', 'original_width', 'hasTable', 'table_count', 'col_count', 'table_bboxes', 'col_bboxes']
processed_data = pd.DataFrame(processed_data, columns=columns_name)
# Save dataframe and inspect it's data
processed_data.to_csv(f"{PROCESSED_DATA}/processed_data.csv", index = False)
print(processed_data.tail())
By now, you should have a dataframe that is filled with data similar to this:
Model Architecture
The authors of the TableNet paper used an encoder-decoder approach with a VGG-19 (pre-trained) as the encoder and two decoders (one for the table and one for the columns).
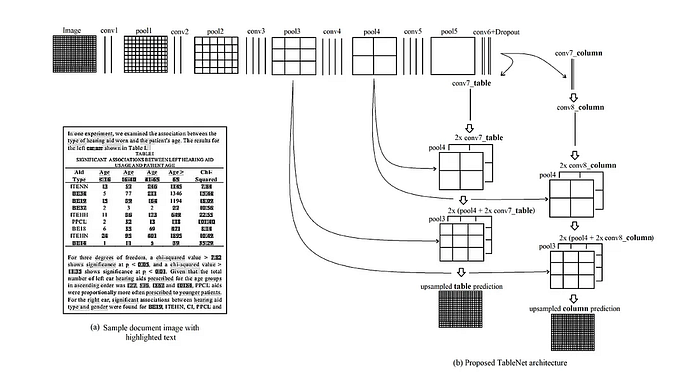
Training
- For the first 50 epochs with a batch size of 2, the table branch of the computational graph is computed twice, and then the column branch of the model is calculated (2:1 ratio)
- Then the model is trained to 100 epochs with a 1:1 training ratio between the table decoder and the column decoder.
The encoder that gave me the best result is the DenseNet121 compared to VGG-19, EfficientNet, and ResNet-18.
The scores were very close to each other, but the DenseNet121 encoder had the best F1 score on the test data.
Model Implementation
- Table decoder
class TableDecoder(nn.Module):
    def __init__(self, channels, kernels, strides):
        super(TableDecoder, self).__init__()
        self.conv_7_table = nn.Conv2d(in_channels = 256, out_channels = 256, kernel_size = kernels[0], stride = strides[0])
        self.upsample_1_table = nn.ConvTranspose2d(in_channels = 256, out_channels=128, kernel_size = kernels[1], stride = strides[1])
        self.upsample_2_table = nn.ConvTranspose2d(in_channels = 128 + channels[0], out_channels = 256, kernel_size = kernels[2], stride = strides[2])
        self.upsample_3_table = nn.ConvTranspose2d(in_channels = 256 + channels[1], out_channels = 1, kernel_size = kernels[3], stride = strides[3])

    def forward(self, x, pool3_out, pool4_out):
        x = self.conv_7_table(x)
        out = self.upsample_1_table(x)
        out = torch.cat((out, pool4_out), dim=1)
        out = self.upsample_2_table(out)
        out = torch.cat((out, pool3_out), dim=1)
        out = self.upsample_3_table(out)
return out- Column decoder
class ColumnDecoder(nn.Module):
    def __init__(self, channels, kernels, strides):
        super(ColumnDecoder, self).__init__()
        self.conv_8_column = nn.Sequential(
            nn.Conv2d(in_channels = 256,out_channels = 256,kernel_size = kernels[0], stride = strides[0]),
            nn.ReLU(inplace=True),
            nn.Dropout(0.8),
            nn.Conv2d(in_channels = 256,out_channels = 256,kernel_size = kernels[0], stride = strides[0])
        )
        self.upsample_1_column = nn.ConvTranspose2d(in_channels = 256, out_channels=128, kernel_size = kernels[1], stride = strides[1])
        self.upsample_2_column = nn.ConvTranspose2d(in_channels = 128 + channels[0], out_channels = 256, kernel_size = kernels[2], stride = strides[2])
        self.upsample_3_column = nn.ConvTranspose2d( in_channels = 256 + channels[1], out_channels = 1, kernel_size = kernels[3], stride = strides[3])

    def forward(self, x, pool3_out, pool4_out):
        x = self.conv_8_column(x)
        out = self.upsample_1_column(x)
        out = torch.cat((out, pool4_out), dim=1)
        out = self.upsample_2_column(out)
        out = torch.cat((out, pool3_out), dim=1)
        out = self.upsample_3_column(out)
return out- TableNet (This is not the full one, containing only the densenet encoder)
class TableNet(nn.Module):
    def __init__(self,encoder = 'densenet', use_pretrained_model = True, basemodel_requires_grad = True):
        super(TableNet, self).__init__()
        self.kernels = [(1,1), (2,2), (2,2),(8,8)]
        self.strides = [(1,1), (2,2), (2,2),(8,8)]
        self.in_channels = 512
        self.base_model = DenseNet(pretrained = use_pretrained_model, requires_grad = basemodel_requires_grad)
        self.pool_channels = [512, 256]
        self.in_channels = 1024
        self.kernels = [(1,1), (1,1), (2,2),(16,16)]
        self.strides = [(1,1), (1,1), (2,2),(16,16)]
        self.conv6 = nn.Sequential(
            nn.Conv2d(in_channels = self.in_channels, out_channels = 256, kernel_size=(1,1)),
            nn.ReLU(inplace=True),
            nn.Dropout(0.8),
            nn.Conv2d(in_channels = 256, out_channels = 256, kernel_size=(1,1)),
            nn.ReLU(inplace=True),
            nn.Dropout(0.8)
        )
        self.table_decoder = TableDecoder(self.pool_channels, self.kernels, self.strides)
        self.column_decoder = ColumnDecoder(self.pool_channels, self.kernels, self.strides)

    def forward(self, x):
        pool3_out, pool4_out, pool5_out = self.base_model(x)
        conv_out = self.conv6(pool5_out)
        table_out = self.table_decoder(conv_out, pool3_out, pool4_out)
        column_out = self.column_decoder(conv_out, pool3_out, pool4_out)
        return table_out, column_out
Also, in PyTorch, if you wish to build a model, you will need a Dataloader:
class ImageFolder(nn.Module):
    def __init__(self, df, transform = None):
        super(ImageFolder, self).__init__()
        self.df = df
        if transform is None:
            self.transform = A.Compose([
                A.Normalize(mean=[0.485, 0.456, 0.406], std=[0.229, 0.224, 0.225], max_pixel_value = 255,),
                ToTensorV2()
            ])
    def __len__(self):
        return len(self.df)

    def __getitem__(self, index):
        image_path, table_mask_path, column_mask_path = self.df.iloc[index, 0], self.df.iloc[index, 1], self.df.iloc[index, 2]
        image = np.array(Image.open(image_path))
        table_image = torch.FloatTensor(np.array(Image.open(table_mask_path))/255.0).reshape(1,1024,1024)
        column_image = torch.FloatTensor(np.array(Image.open(column_mask_path))/255.0).reshape(1,1024,1024)
        image = self.transform(image = image)['image']
        return {"image": image, "table_image": table_image, "column_image": column_image}
The ImageFolder data loader class takes a dataframe as an input, the dataframe contains the path of images, table masks, and column masks.
Every Image is normalized and then converted to a PyTorch tensor dataset.
This dataset object is wrapped inside a DataLoader class, which will return batches of data per iteration.
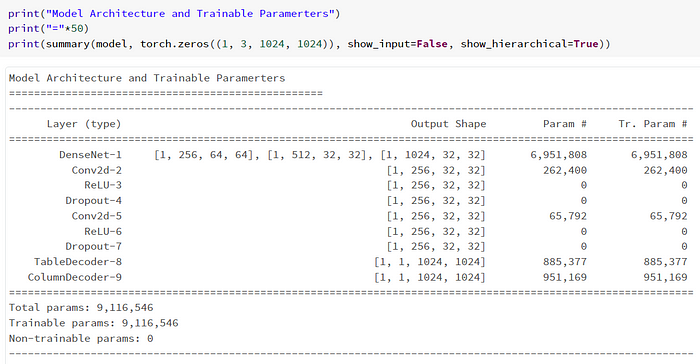
Using pytorch_model_summary.summary will give us the following:
Train, Test, Loss
Lossfunction
The loss function that will be used for this model is torch.nn.BCEWithLogitsLoss() this loss function combines the Sigmoid and the Binary Cross Entropy Loss functions. You can read more about it here.
import torch.nn as nn

class TableNetLoss(nn.Module):
    def __init__(self):
        super(TableNetLoss, self).__init__()
        self.bce = nn.BCEWithLogitsLoss()

    def forward(self, table_prediction, table_target, column_prediction = None, column_target = None, ):
        table_loss = self.bce(table_prediction, table_target)
        column_loss = self.bce(column_prediction, column_target)
return table_loss, column_lossTrainfunction
The train function returns a metric dictionary containing the current epoch's F1 Score, Accuracy, Precision, Recall, and Loss.
Note that F1 Score, as I said, takes into account the recall and precision, but I wanted to know which one of these is better or worse.
def train_on_epoch(data_loader, model, optimizer, loss, scaler, threshold = 0.5):
    combined_loss = []
    table_loss, table_acc, table_precision, table_recall, table_f1 = [], [], [], [], []
    column_loss, column_acc, column_precision, column_recall, column_f1 = [], [], [], [], []
    loop = tqdm(data_loader, leave = True)
    for batch_i, image_dict in enumerate(loop):
        image            = image_dict["image"].to(DEVICE)
        table_image      = image_dict["table_image"].to(DEVICE)
        column_image     = image_dict["column_image"].to(DEVICE)
        with torch.cuda.amp.autocast():
            table_out, column_out = model(image)
            i_table_loss, i_column_loss = loss(table_out, table_image, column_out, column_image)
        table_loss.append(i_table_loss.item())
        column_loss.append(i_column_loss.item())
        combined_loss.append((i_table_loss + i_column_loss).item())
        # Backward
        optimizer.zero_grad()
        scaler.scale(i_table_loss + i_column_loss).backward()
        scaler.step(optimizer)
        scaler.update()
        mean_loss = sum(combined_loss) / len(combined_loss)
        loop.set_postfix(loss = mean_loss)
        cal_metrics_table = compute_metrics(table_image, table_out, threshold)
        cal_metrics_col = compute_metrics(column_image, column_out, threshold)
        table_f1.append(cal_metrics_table['f1'])
        table_precision.append(cal_metrics_table['precision'])
        table_acc.append(cal_metrics_table['acc'])
        table_recall.append(cal_metrics_table['recall'])
        column_f1.append(cal_metrics_col['f1'])
        column_acc.append(cal_metrics_col['acc'])
        column_precision.append(cal_metrics_col['precision'])
        column_recall.append(cal_metrics_col['recall'])
        metrics = {
          'combined_loss': np.mean(combined_loss),
          'table_loss': np.mean(table_loss),
          'column_loss': np.mean(column_loss),
          'table_acc': np.mean(table_acc),
          'col_acc': np.mean(column_acc),
          'table_f1': np.mean(table_f1),
          'col_f1': np.mean(column_f1),
          'table_precision': np.mean(table_precision),
          'col_precision': np.mean(column_precision),
          'table_recall': np.mean(table_recall),
          'col_recall': np.mean(column_recall)
        }
return metricsTestfunction
The test function is very similar to the train function and returns the F1 Score, Accuracy, Precision, Recall, and Loss for the current epoch.
def test_on_epoch(data_loader, model, loss, threshold = 0.5, device = DEVICE):
    combined_loss = []
    table_loss, table_acc, table_precision, table_recall, table_f1 = [], [], [], [], []
    column_loss, column_acc, column_precision, column_recall, column_f1 = [], [], [], [], []
    model.eval()
    with torch.no_grad():
        loop = tqdm(data_loader, leave = True)
        for batch_i, image_dict in enumerate(loop):
            image            = image_dict["image"].to(device)
            table_image      = image_dict["table_image"].to(device)
            column_image     = image_dict["column_image"].to(device)
            with torch.cuda.amp.autocast():
                table_out, column_out  = model(image)
                i_table_loss, i_column_loss = loss(table_out, table_image, column_out, column_image)
            table_loss.append(i_table_loss.item())
            column_loss.append(i_column_loss.item())
            combined_loss.append((i_table_loss + i_column_loss).item())
            mean_loss = sum(combined_loss) / len(combined_loss)
            loop.set_postfix(loss=mean_loss)
            cal_metrics_table = compute_metrics(table_image, table_out, threshold)
            cal_metrics_col = compute_metrics(column_image, column_out, threshold)
            table_f1.append(cal_metrics_table['f1'])
            table_precision.append(cal_metrics_table['precision'])
            table_acc.append(cal_metrics_table['acc'])
            table_recall.append(cal_metrics_table['recall'])
            column_f1.append(cal_metrics_col['f1'])
            column_acc.append(cal_metrics_col['acc'])
            column_precision.append(cal_metrics_col['precision'])
            column_recall.append(cal_metrics_col['recall'])
    metrics = {
        'combined_loss': np.mean(combined_loss),
        'table_loss': np.mean(table_loss),
        'column_loss': np.mean(column_loss),
        'table_acc': np.mean(table_acc),
        'col_acc': np.mean(column_acc),
        'table_f1': np.mean(table_f1),
        'col_f1': np.mean(column_f1),
        'table_precision': np.mean(table_precision),
        'col_precision': np.mean(column_precision),
        'table_recall': np.mean(table_recall),
        'col_recall': np.mean(column_recall)
    }
    model.train()
    return metrics
The model is trained for about 100 epochs with early stopping.
In each epoch, I use both the train_on_epoch and the test_on_epoch functions, display them, and check them against the last epoch scores.
The model got quite a good scoring. The final scores of the model are:
- Table Loss - Train: 0.011 Test: 0.087
- Table Acc - Train: 0.995 Test: 0.981
- Table F1 - Train: 0.723 Test: 0.907
- Table Precision - Train: 0.721 Test: 0.918
- Table Recall - Train: 0.724 Test: 0.906
Prediction Examples
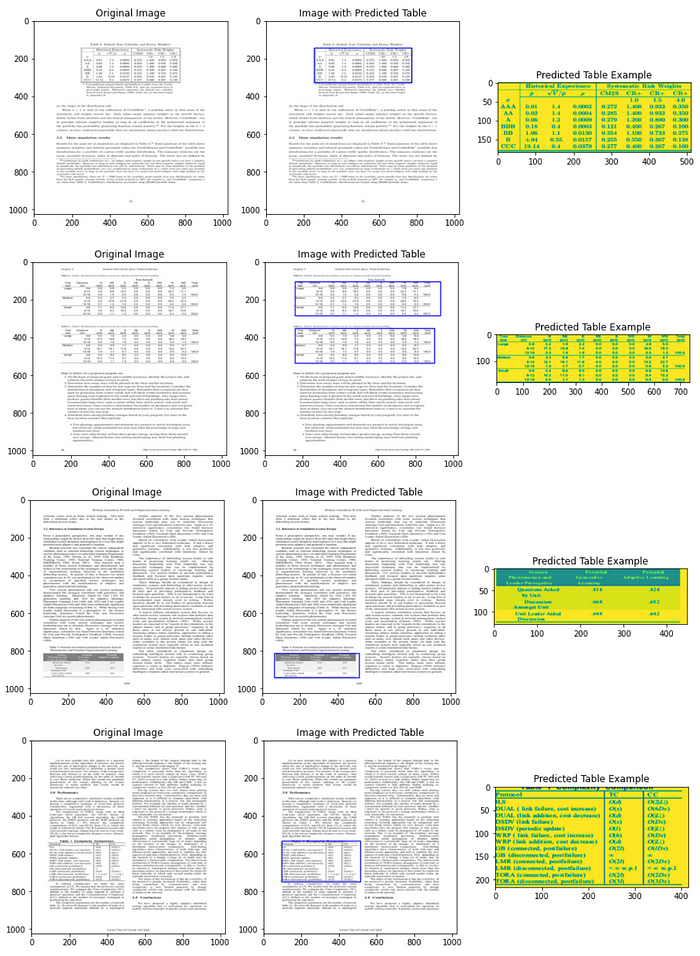
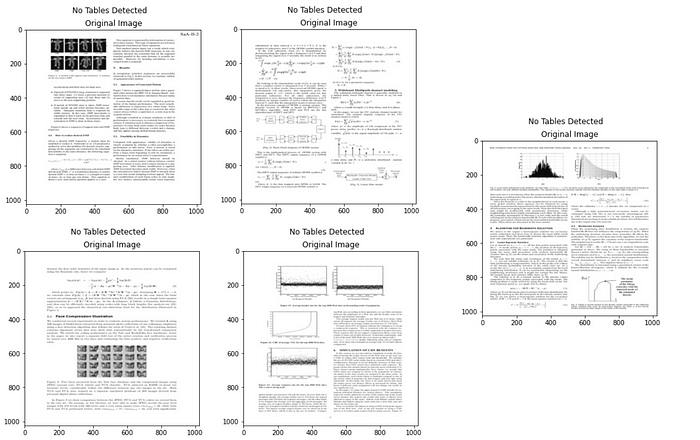
Here are a few examples of the model predictions (with and without tables)
- Predictions of images with tables in them
- Predictions of images without tables in them
Next Actions
Now after the model is trained, the next stage is to extract the tabular data from the images and, for example, insert it into a dataframe, if you want to know more about it, you can refer to my other article that is just about that here: Image Table to DataFrame using Python OCR.
0 Comments