Use Google Colab, Google Data Studio and Google Sheets to Build predictive Business Intelligence

Many of us are used to thinking that Business Intelligence is something that large companies use and that is created with tools that are expensive and often difficult to learn (although there are pleasant exceptions, such as Metabase and Superset). In my article, I want to show that practically everyone can use the power of Business Intelligence, and even add some Predictive Analytics to it with generally available and free online tools, such as Google Colab and Google Data Studio. Database deployment is not required. All data for analysis and visualization we will store in Google Sheets.
We will implement a machine learning model in Google Colab and, based on the sales history of the products, we will be able to predict future sales for several months and visualize our prediction in Google Data Studio.
We will use the dataset with information about the list of products and the sales history for 12 months for each product.
The model will analyze the sales history and changes in product features for each month, so that any change will dynamically affect the model predictions. This will allow us to quickly assess the consequences of certain decisions and adopt an optimal development strategy.
Load Data
We consider, that all operations we do in Google Colab. First of all we will use kaggle module to download needed dataset. You can read in more detail about module and how to get Kaggle API Token by this link.
Dataset description: https://www.kaggle.com/c/online-sales/data .
!pip install kaggleAs we are using Google Colab, we will connect to Google Drive to copy Kaggle credentials.
from google.colab import drive
drive.mount(‘/content/drive/’)
Set a working directory with saved credentials (in our case directory is called “Colab Notebooks”).
import os
os.chdir(“/content/drive/My Drive/Colab Notebooks”)
Copy credentials for Kaggle API.
import os
os.chdir(“/content/drive/My Drive/Colab Notebooks”)
Download the dataset.
!kaggle competitions download -c online-salesLoad the dataset into the memory and replace null values with zeroes.
import pandas as pd
import numpy as np
from matplotlib import pyplot as pltdf = pd.read_csv(“TrainingDataset.csv”)
df = df.replace(np.nan, 0, regex=True)
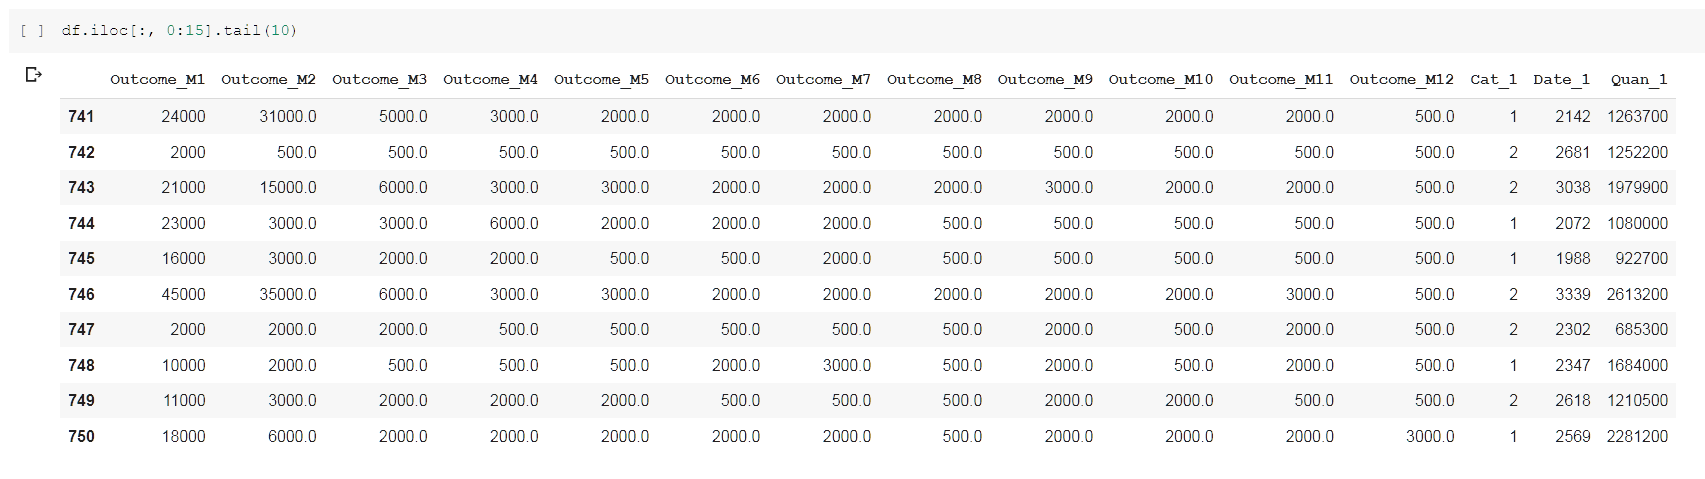
Now we can preview our dataset.

We will split our dataset into the training part (on which we will train our model) and the test part (on which we will test the correctness of our model).
from sklearn.model_selection import train_test_splitdf_train, df_test = train_test_split(df, test_size=0.2)
print(df_train.shape)
print(df_test.shape)
Exploratory Data Analysis
Let’s visualize our data. We will show the price change dynamics for 10 random products.
import randomindexes = random.sample(range(len(df)), 10)
df_plot = pd.DataFrame()for i in indexes:
  df_plot[“product_”+str(i)] = df.iloc[i, 0:12]df_plot.plot();

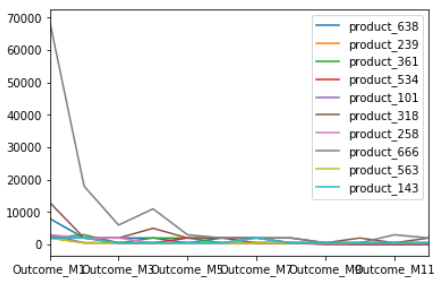
As we see, sales are declining throughout the year in most cases.
Prepare data
We need to prepare our data in a special way to load into our model. We will build a model that forecasts future month outcome based on previous values. For each month model will analyze product features and information about previous month outcome.
Firstly, we will separate product features and information about outcome per month.
y_train_real = df_train.iloc[:, 0:12].values
print(y_train_real.shape)y_test_real = df_test.iloc[:, 0:12].values
print(y_test_real.shape)x_train_real = df_train.iloc[:, 12:].values
x_test_real = df_test.iloc[:, 12:].values
print(x_train_real.shape)
print(x_test_real.shape)
Scale values in one range for better predictions.
from sklearn.preprocessing import MinMaxScaler#scale datasets
x_scaler = MinMaxScaler()
x_scaler = x_scaler.fit(x_train_real)
x_train = x_scaler.transform(x_train_real)
x_test = x_scaler.transform(x_test_real)y_scaler = MinMaxScaler()
y_scaler = y_scaler.fit(y_train_real)
y_train = y_scaler.transform(y_train_real)
y_test = y_scaler.transform(y_test_real)
Now let us move to the most important step of this process: convert price history to multidimensional time series. For each product we will create TimeSeries with 1–12 timesteps with information about product features and previous timestep outcome. We do not know previous outcome for first timestep, so we will just take zero.
Here we create lists for training and test data, each list will contain 12 3-dimensional numpy arrays. Second dimension for each array will represent timesteps and gradually increases by 1.
x_train_series = []
x_test_series = []for k in range(len(y_train[0])):
  x_train_series.append(np.zeros((x_train.shape[0], k+1, x_train.shape[1]+1)))for k in range(len(y_test[0])):
  x_test_series.append(np.zeros((x_test.shape[0], k+1, x_test.shape[1]+1)))
Add to each timestep information about product features and previous timestep outcome. Now we are using the same product features for each timestep, but the model allows to track features changes on each timestep to make more accurate predictions.
for k in range(len(y_train[0])):
  for i in range(len(x_train)):
    for j in range(k + 1):
      shifted_index = j - 1
      if shifted_index < 0:
        x_train_series[k][i, j] = np.append(x_train[i], 0)
      else:
        x_train_series[k][i, j] = np.append(x_train[i], y_train[i, shifted_index])
The same timesteps conversion for test data.
for k in range(len(y_test[0])):
  for i in range(len(x_test)):
    for j in range(k + 1):
      shifted_index = j - 1
      if shifted_index < 0:
        x_test_series[k][i, j] = np.append(x_test[i], 0)
      else:
        x_test_series[k][i, j] = np.append(x_test[i], y_test[i, shifted_index])
Make 12 lists with information about outcome per TimeSerie, per product.
y_train_series = []
y_test_series = []for k in range(len(y_train[0])):
  y_train_series.append(np.zeros((len(y_train), 1)))
  y_test_series.append(np.zeros((len(y_test), 1)))


for k in range(len(y_train[0])):
  y_train_series[k] = y_train[:, k].reshape(-1, 1)
  y_test_series[k] = y_test[:, k].reshape(-1, 1)
Building LSTM Neural Network
We will use long short term memory (LSTM) network of the Recurrent neural network (RNN). You can read more about these types of NN here:
http://colah.github.io/posts/2015-08-Understanding-LSTMs/
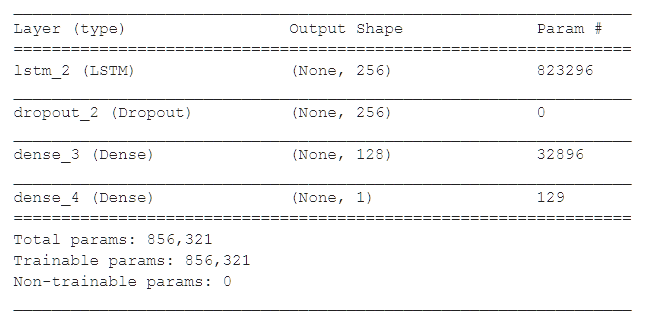
We use Keras framework for deep learning. Our model consists of just one LSTM layer with 256 units, one Dense layer with 128 units and the densely connected output layer with one neuron. We also added one Dropout layer to avoid overfitting. Model stays simple and quick, still able to make useful predictions.
from keras.models import Sequential
from keras.layers import Dense
from keras.layers import LSTM
from keras.layers import Dropoutmodel = Sequential()
model.add(LSTM(256, input_shape=(None, x_train.shape[1]+1)))
model.add(Dropout(0.5))
model.add(Dense(128, activation = "relu"))
model.add(Dense(1))
model.summary()

model.compile(loss='mse', optimizer='rmsprop')Train our model :
for i in range(len(x_train_series)):
  print(i)
  model.fit(x_train_series[i], y_train_series[i], epochs=10, validation_split=0.2)
Evaluate model for prediction of outcome after several months.
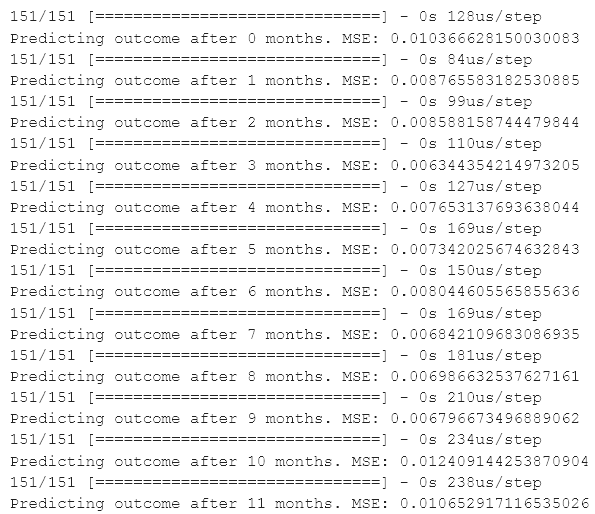
for i in range(len(x_test_series)):
  accr = model.evaluate(x_test_series[i], y_test_series[i])
  print("Predicting outcome after {} months. MSE:".format(i), accr)
Outcome prediction function
We will use our model to create a recursive function that will take information about product features and outcome history during several months. As a result this function will predict future outcome for as many months as you wish.
def predictor(features, history, future):
  '''
  features: list of product features
  history: list with outcome per month
  future: int, number of months to predict outcome
  '''
  if future == 0:
    return history

  p_serie = np.zeros((1, len(history), len(features)+1))

  for j in range(len(history)):
    shifted_index = j - 1
    if shifted_index < 0:
      p_serie[0, j] = np.append(features, 0)
    else:
      p_serie[0, j] = np.append(features, history[shifted_index])

  prediction = model.predict(p_serie)

  history.append(prediction[0][0])
  future -= 1

  return predictor(features, history, future)
We will test our function on a random product n. We will create two lists. First with outcome history for first m months, second with product features
import randomn = random.choice(range(len(x_test)-1))
m = 6
future = 6features = x_test[n].tolist()
history = y_test[n, 0:m].tolist()
Plot results of prediction comparing with real data
prediction = predictor(features, history, future)plt.plot(y_scaler.inverse_transform([prediction])[0])
plt.plot(y_scaler.inverse_transform([y_test[n, :m+future]])[0])
plt.title('Predicted and real outcome')
plt.legend(['predicted', 'real'], loc='upper left')
axes = plt.gca()plt.show()

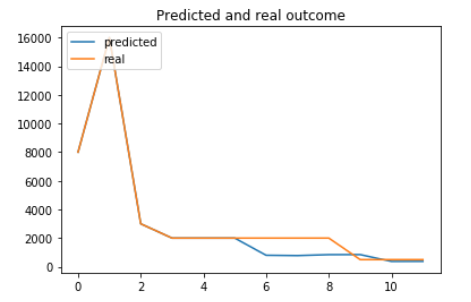
As we can see it quite accurately showed sales change overall trend. Not bad result for a comparably simple model.
Display predictions in Google Data Studio
Now, when we have our predicted data, we can display it in Google Data Studio, a Google’s Business Intelligence solution. One of the advantages of this tool is that it can be used for free to make custom reports and dashboards.
Google Data Studio can connect multiple data sources for reporting. Google Sheets as data source is suitable for our purposes. We will save our predictions as a Google Sheet, and Google Data Studio will display the data from it on the dashbord. Thus, we can easily integrate Google Colaboratory and Data Studio.
I will not explain in detail Google Data Studio functionality. You can learn about it in the official documentation https://developers.google.com/datastudio/
We will take three random products, save predictions and outcome history for each. To save our data to Google Spreadsheet we will use gspread library.
Wee will need a client key to write on a Google Spreadsheet. How to get the key is described here https://gspread.readthedocs.io/en/latest/oauth2.html.
!pip install — upgrade oauth2client gspreadConnect to Google Sheets.
import gspread
from oauth2client.service_account import ServiceAccountCredentialsscope = ['https://spreadsheets.google.com/feeds',
         'https://www.googleapis.com/auth/drive']credentials = ServiceAccountCredentials.from_json_keyfile_name('spreadkey.json', scope)gc = gspread.authorize(credentials)
Make lists with real and predicted outcome history for three random products. For testing purposes we are using data from test dataset, but in real scenario you can insert any changes of product features in Google Sheets, load data from Google Sheets and make a prediction.
real_data = []
predicted_data = []for i in range(3):
  n = random.choice(range(len(x_test)-1))
  m = 6
  future = 6
  features = x_test[n].tolist()
  history = y_test[n, 0:m].tolist()  prediction = predictor(features, history, future)  predicted_data.append(y_scaler.inverse_transform([prediction])[0])
  real_data.append(y_scaler.inverse_transform([y_test[n, :m+future]])[0])
Open Google Sheet for saving real and predicted data. We have two worksheets in it: “real” for real data, “predicted” for predicted data.
ws = gc.open('TrainingDataset2')ws_predicted = ws.worksheet("predicted")
ws_real = ws.worksheet("real")
Write our real and predicted data to Google Sheets. We will write starting from the second row, reserving first row for column names(Product1, Product2, Product3).
for j in range(len(real_data)):
  for i in range(len(real_data[0])):
    ws_predicted.update_cell(i+2, j+1, float(predicted_data[j][i]))
    ws_real.update_cell(i+2, j+1, float(real_data[j][i]))


for i in range(len(real_data[0])):
    # add index column
    ws_predicted.update_cell(i+2, len(real_data)+1, i)
    ws_real.update_cell(i+2, len(real_data)+1, i)
Review our data at Google Sheets
ws_real.get_all_records()[6:11]
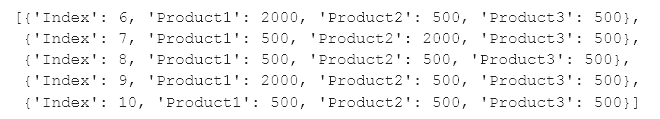
As we have Google Sheets filled with real and predicted outcome, now we can connect Google Sheets as a datasource in Google Data Studio.
In Google Data Studio, create new dashboard and create a Data Source for it. You will find a Google Sheets in sources list. Add your Google Sheet as a data source.
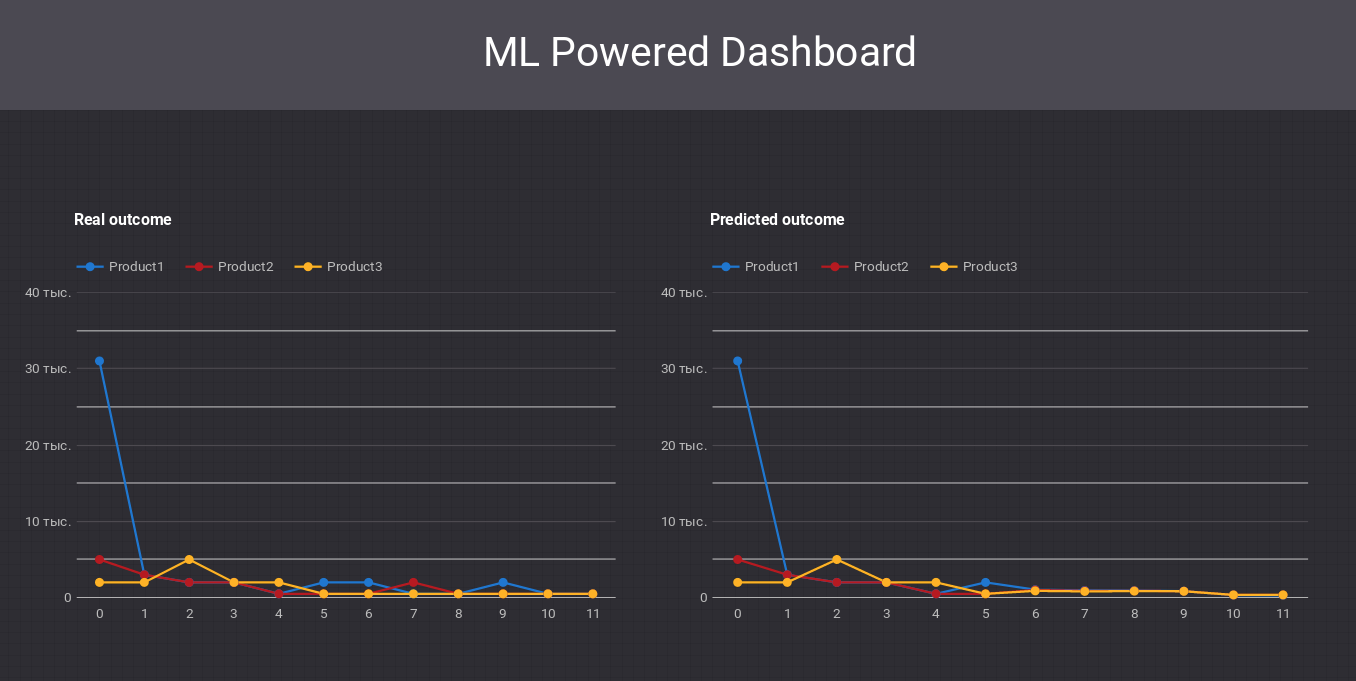
Based on data from “predicted” and “real” worksheets we can make diagrams showing outcome change.
That’s it! Now you have AI Powered Dashboard, showing predictions about future outcome!
Conclusion
The main idea of this article is that Business Intelligence with even some AI features is more accessible than we can think. You can create advanced analytics, embed proposed graphs into your analytics reports and have an idea of both the current situation and the near future. All changes, that you want to check can be quickly inserted in Google Sheets, predicted consequences will be calculated in Google Colab and shown in Google Data Studio.
You can find Google Colab Notebook with all described code by this link.


0 Comments