Top Pyspark Features to become ETL Master
Become master to use Pyspark for ETL, the one of the most used Python tools for Big Data Analysis


As we know, the volume of data is increase by hour, really really big data. The amount of the newly created data in 2020 was predicted to grow 44X to reach 35 zettabytes (35 trillion gigabytes). And the most of theme, they are raw data. So the problem of science is how to research, investigate to find the mining of big data (Data Mining). Fortunately, our excellent developers was built many tools, frameworks for processing , ETL (Extract, Transform, Loading) big data and one of theme is Spark.
So What is Spark and Why?
Spark is a general-purpose distributed data processing engine that is suitable for use in a wide range of circumstances. On top of the Spark core data processing engine, there are libraries for SQL, machine learning, graph computation, and stream processing, which can be used together in an application. Programming languages supported by Spark include: Java, Python, Scala, and R. Application developers and data scientists incorporate Spark into their applications to rapidly query, analyze, and transform data at scale. Tasks most frequently associated with Spark include ETL and SQL batch jobs across large data sets, processing of streaming data from sensors, IoT, or financial systems, and machine learning tasks.
You can read more about Spark in here. Some detail information in Spark as: MapReduce, How to Spark run in Clusters, Spark Streaming, how it run Pipeline ……
In this fundamental topic, I only focus on Spark SQL for data processing, how to write the and use Python for example (Pyspark).
The dataset will be use for practical is Movie dataset from Megogo Challenge in Kaggle. You can view and download it in here.
Note: We assume you have knowledge about data frame (Maybe a little with Pandas.) If not, you can read my blog in here about Pandas first. If you have knowledge about Pandas, I think you can learn Pysark for ETL easier and faster.
Installing
You can following in this document from Spark to install. (It is not complex to install theme, so I really believe you can do it by yourself :D ).
Generic Load/Save Functions
In the simplest form, the default data source (parquet unless otherwise configured by spark.sql.sources.default) will be used for all operations.


You can also manually specify the data source that will be used along with any extra options that you would like to pass to the data source. Data sources are specified by their fully qualified name (i.e., org.apache.spark.sql.parquet), but for built-in sources you can also use their short names (json, parquet, jdbc, orc, libsvm, csv, text). DataFrames loaded from any data source type can be converted into other types using this syntax.


More, we have many kind of load data with Spark. Not only local, we can load data from AWS S3, GCS, Redshift, Athena, SFTP, Google BigQuery …. with one magic line. (spark.read.load) 💁, so amazing….
Actually, we can have load, extract and read data from one query. But normally, I don’t recommend you use that because it not easy to trace back and validate data. Example:


Oki lah, Now we will read our movie dataset to go to detail.

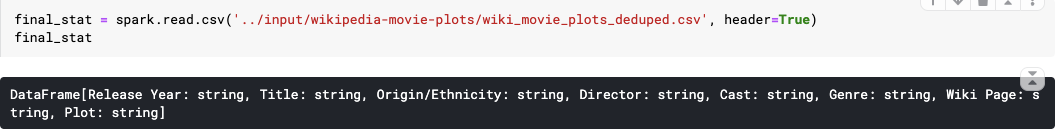
It seem ok, Now we will go to main of this fundamental topic.
TOP 100 Pyspark Features
pyspark.sql.DataFrame
- show(n) : Show and return top n rows of this data frame.


2. collect() : Returns all the records as a list of Row.


3. columns (property) : Returns all column names as a list.


4. count() : Returns the number of rows in this DataFrame.


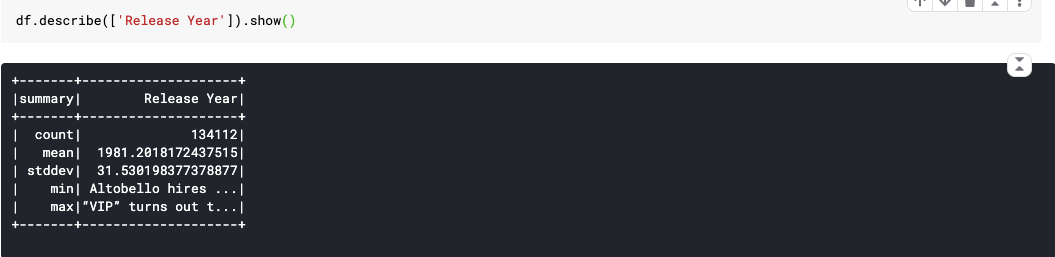
5. describe() : Computes basic statistics for numeric and string columns.
This include count, mean, stddev, min, and max. If no columns are given, this function computes statistics for all numerical or string columns.
Actually this is not good example because in this data, we don’t have columns is number, but I think you can easy understand that.

6. Distinct() : Returns a new DataFrame containing the distinct rows in this DataFrame.
You can see the example to recognize the number of records reduced because distinct method was drop some duplicate row in original data frame.


7. drop(*cols) : Returns a new DataFrame that drops the specified column. This is a no-op if schema doesn’t contain the given column name(s).
Example, you can see 3 columns in [‘Director’, ‘Genre’, ‘Cast’] was deleted.


8. dropDuplicates() : Return a new DataFrame with duplicate rows removed, optionally only considering certain columns.


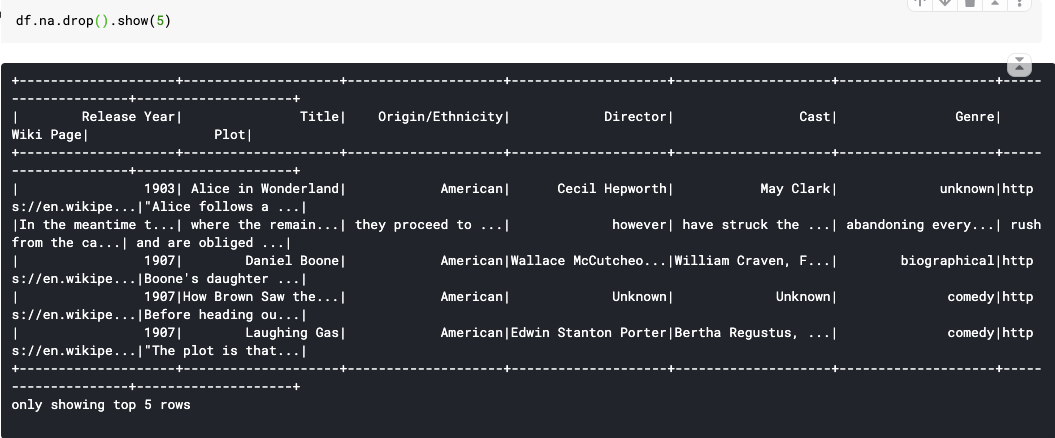
9. dropna(how=’any’, thresh=None, subset=None) : Returns a new DataFrame omitting rows with null values.

10. explain() : Prints the (logical and physical) plans to the console for debugging purpose.
Actually, to become expert pyspark ETL, you have to understand this feature clearly. It will be show how your query complex and you can optimize the performance of query base on that. I will have a specific advance topic to discuss about that. In here, I only show you the example:


11. fillna(): Replace null values, alias for na.fill()


12. filter(condition) : Filters rows using the given condition.


13. First() : Returns the first row as a Row.


14. foreach(function) : Applies the f function to all Row of this DataFrame.


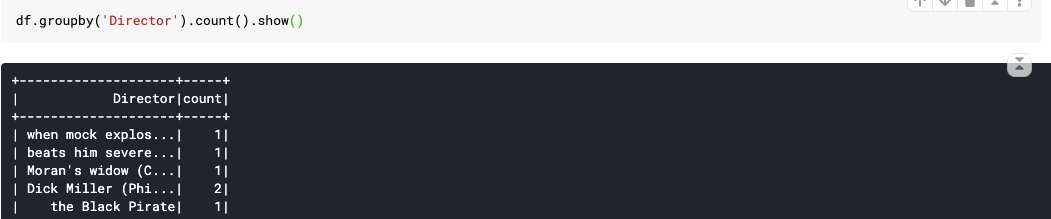
15. groupBy(*cols) : Groups the DataFrame using the specified columns, so we can run aggregation on them. See GroupedData for all the available aggregate functions.

16. head(n) : Returns the first n rows.


17. join(): Joins with another DataFrame, using the given join expression.
Actually it quite same as SQL Join or Pandas Concat. So I only show you simple example. (But we will talk how to optimize when using join in next topic: advanced pyspark)


18. Limit() : Limits the result count to the number specified.


19. orderBy(*cols, **kwargs): Returns a new DataFrame sorted by the specified column(s).


20. printSchema(): Prints out the schema in the tree format.


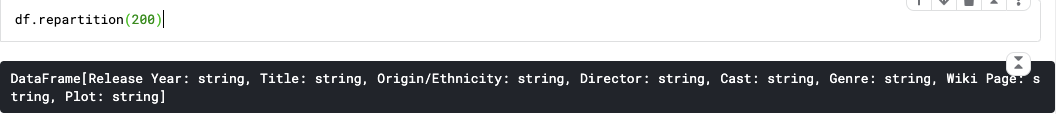
21. repartition() : Returns a new DataFrame partitioned by the given partitioning expressions. The resulting DataFrame is hash partitioned.
One of the ways to improve performance of ETL query is partition. If we can calculate the good number partition, your performance will be better. (Talk about advance topic.)

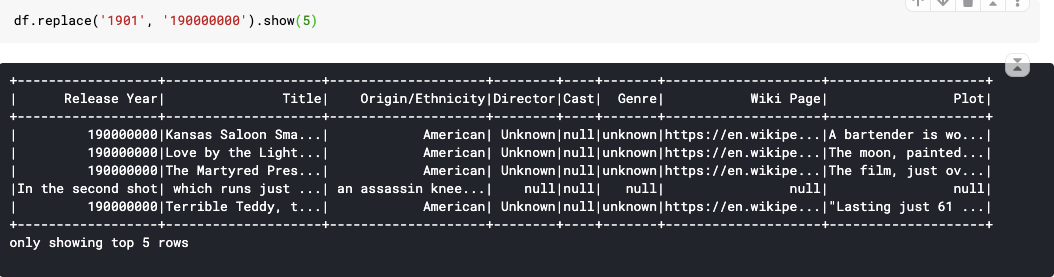
22. replace() : Returns a new DataFrame replacing a value with another value.

23. rollup(*cols) : Create a multi-dimensional rollup for the current DataFrame using the specified columns, so we can run aggregation on them.


24. select() : Projects a set of expressions and returns a new DataFrame.


25. selectExpr() : Projects a set of SQL expressions and returns a new DataFrame.
26. sort(*cols, **kwargs) : Returns a new DataFrame sorted by the specified column(s).


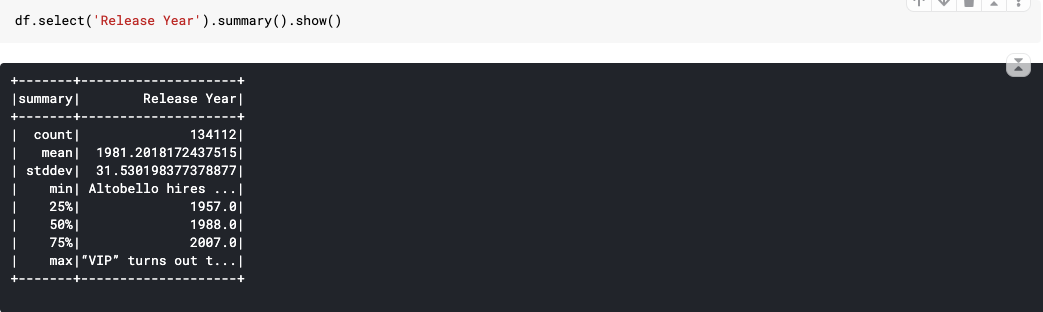
27. Summary(*statistics): Computes specified statistics for numeric and string columns. Available statistics are: — count — mean — stddev — min — max — arbitrary approximate percentiles specified as a percentage (eg, 75%)

28. toPandas() : Returns the contents of this DataFrame as Pandas pandas.DataFrame. This is only available if Pandas is installed and available.


29. union() : Return a new DataFrame containing union of rows in this and another DataFrame.
30. unpersist() : Marks the DataFrame as non-persistent, and remove all blocks for it from memory and disk. Normally, when you use Pyspark for pipeline, this feature will be useful to clear memory after each part. Remember to use that if you face this problem.
31. withColumn() : Returns a new DataFrame by adding a column or replacing the existing column that has the same name.


32. withColumnRenamed() : Returns a new DataFrame by renaming an existing column. This is a no-op if schema doesn’t contain the given column name.


pyspark.sql.GroupedData
A set of methods for aggregations on a DataFrame, created by DataFrame.groupBy().
33. agg() : Compute aggregates and returns the result as a dataframe.


34. apply(udf): Maps each group of the current DataFrame using a pandas udf and returns the result as a DataFrame.The user-defined function should take a pandas.DataFrame and return another pandas.DataFrame. For each group, all columns are passed together as a pandas.DataFrame to the user-function and the returned pandas.DataFrame are combined as a DataFrame.


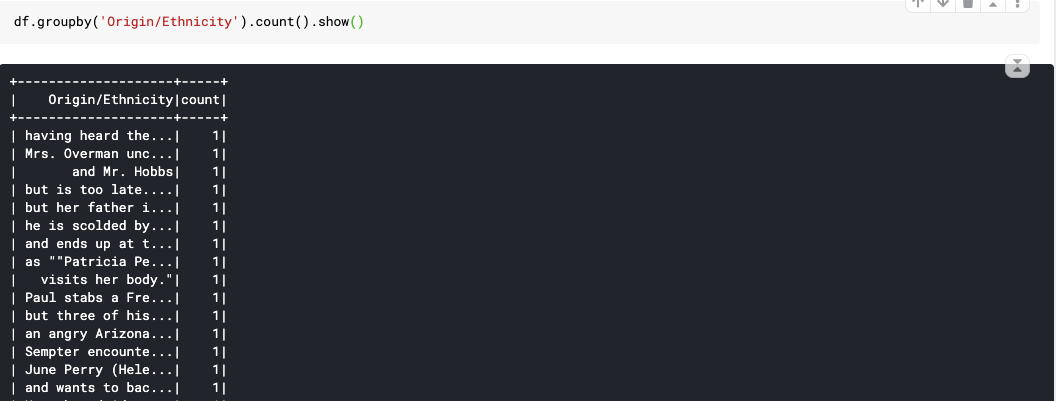
35. avg(), count(), max(), mean(), min(), sum()
This is really simple function to apply after groupby. So I only give you an example with count() :

36. pivot(): Pivots a column of the current dataframe and perform the specified aggregation. There are two versions of pivot function: one that requires the caller to specify the list of distinct values to pivot on, and one that does not. The latter is more concise but less efficient, because Spark needs to first compute the list of distinct values internally.

pyspark.sql.Column
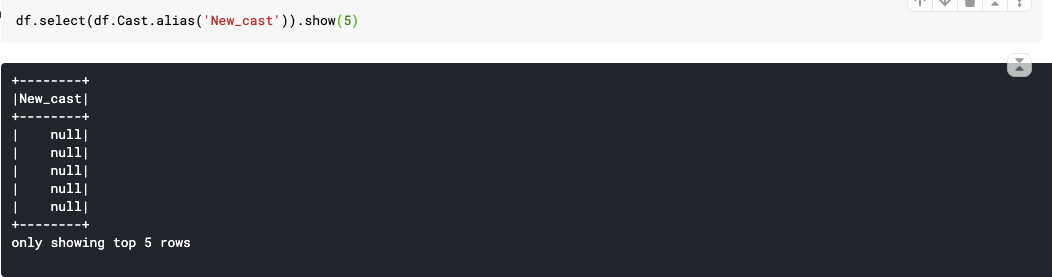
37. alias(): Returns this column aliased with a new name or names (in the case of expressions that return more than one column, such as explode).

38. asc() : Returns a sort expression based on ascending order of the column.


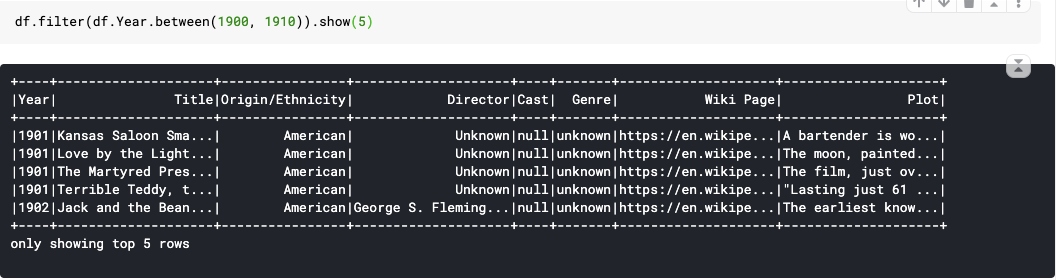
39. between() : A boolean expression that is evaluated to true if the value of this expression is between the given columns.

40. cast(dataType): Convert the column into type dataType.


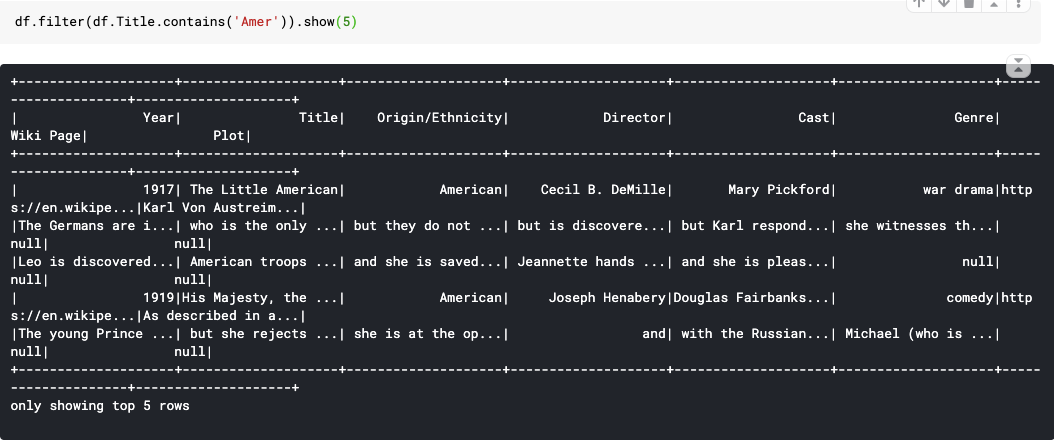
41. contain() : Contains the other element. Returns a boolean Column based on a string match.

42. desc() : Returns a sort expression based on the descending order of the column.


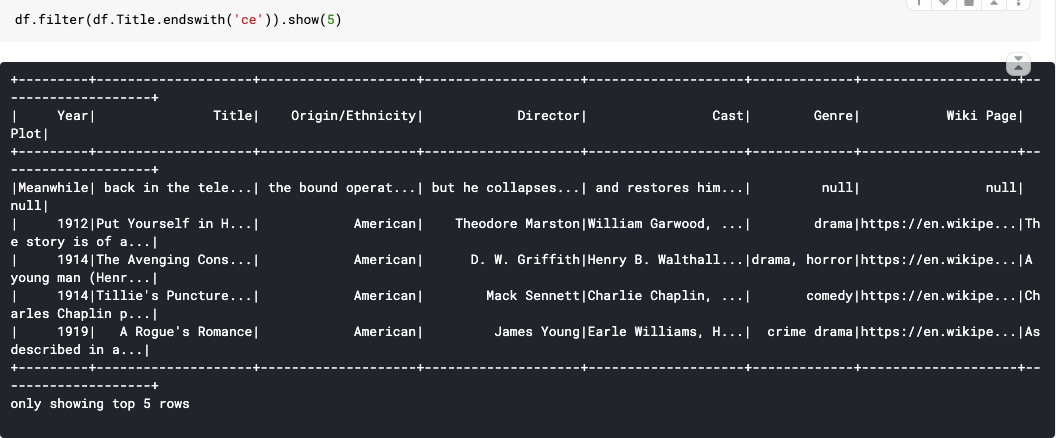
43. endswith(): String ends with. Returns a boolean Column based on a string match.

44. isNotNull() : True if the current expression is NOT null.

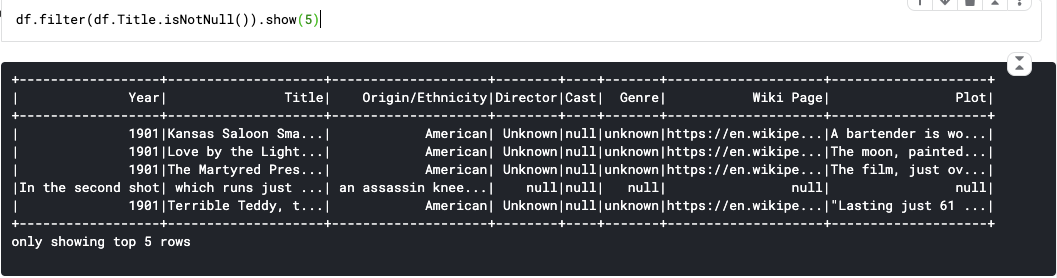
45. isNull() : True if the current expression is null. (Equal with ~isNotNull())


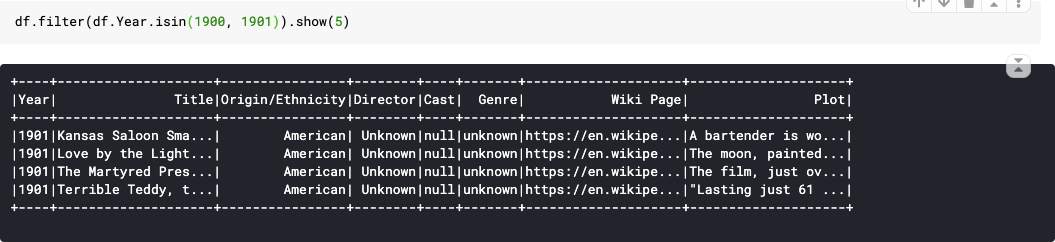
46. isin(*) : A boolean expression that is evaluated to true if the value of this expression is contained by the evaluated values of the arguments.

47. like() : SQL like expression. Returns a boolean Column based on a SQL LIKE match.


48. otherwise(): Evaluates a list of conditions and returns one of multiple possible result expressions. If Column.otherwise() is not invoked, None is returned for unmatched conditions.


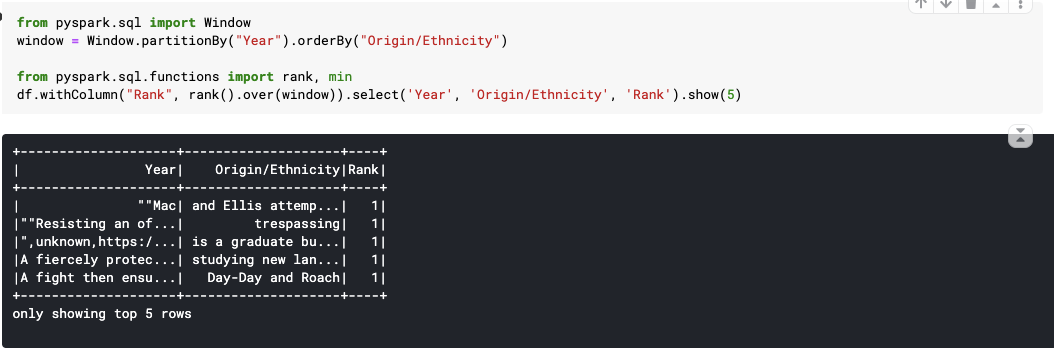
49. over() : Define a windowing column.

50. startswith() : String starts with. Returns a boolean Column based on a string match. It look like endswith() so I will don’t give you example.
You can practice and try some query like me in here.
I think it is enough for you to cover basic ETL with Pyspark. Most of theme, you will use a lot. I hope this fundamental topic will useful for you. (Clap this blog if you want to do that =))) ).
See you in advanced topic with ETL Pyspark.
Content from : https://medium.com/@minhtc.uet/top-100-pyspark-features-master-etl-with-pyspark-1-fundamental-310c72938d14


0 Comments